
Using Microsoft Excel to analyze content performance and fuel social media growth
Introduction
My journey into this data analysis project started with a simple curiosity: how can I make better decisions using data? As a content creator passionate about growth, I applied my skills to a personal challenge—growing my TikTok channel. Inspired by the desire to understand what truly resonates with audiences, I analyzed my content’s performance, uncovering strategies that led to over 6,000 new followers in just two months. This project reflects how data, when used effectively, can transform outcomes and drive success.
Project Overview
This project entails a detailed analysis of my TikTok channel's performance data, covering the period from May 30, 2024, to July 31, 2024. The dataset includes key metrics such as post dates, times, likes, comments, views, favorites, songs used, voiceovers, TikTok sounds, and hashtag usage. Following the structured Data Analysis Process, I implemented the stages: ASK, PREPARE, PROCESS, ANALYZE, SHARE, and ACT to uncover valuable insights.
Tools and Techniques
For this project, I employed various Microsoft Excel techniques, including:
1. Data Entry: Capturing detailed metrics for each TikTok post.
2. Functions and Formulas: Utilizing Excel’s functions and custom formulas for data manipulation and analysis.
3. Macros and VBA: Automating repetitive tasks to streamline efficiency and ensure accuracy.
4. PivotTables: Summarizing and exploring data for meaningful insights.
5. Themes: Designing a professional, visually appealing dashboard.
Data Analysis Process
ASK
I started by defining the key questions to guide my analysis:
1. What type of content resonates most with my audience?
2. What are the optimal posting times for maximum engagement?
3. How do elements such as hashtags and sounds impact engagement metrics?
PREPARE
The next step was preparing the data for analysis by:
1. Ensuring accurate and consistent data entry for all metrics.
2. Structuring the data for easy interpretation and analysis.
PROCESS
I then cleaned and processed the data:
1. Correcting inconsistencies and errors.
2. Categorizing date data into weekday segments (Monday through Sunday).
3. Creating additional columns for derived metrics such as engagement rates.
ANALYZE
In the analysis phase, I used Excel tools to uncover key insights:
1. PivotTables helped summarize data and identify patterns.
2. Charts and Graphs provided visual representations of trends and comparisons.
3. Formulas calculated engagement rates and other key metrics.
SHARE
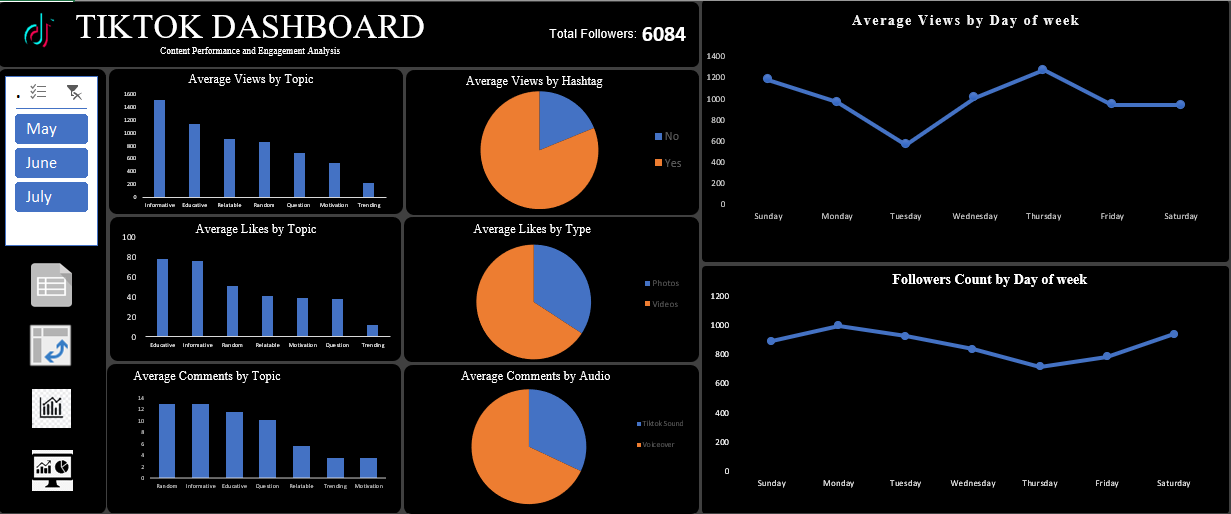
I presented my findings through an interactive and visually engaging Excel dashboard:
1. The dashboard highlights key performance metrics such as average views, likes, and comments by topic, hashtag, audio type, and posting time.
2. It serves as a comprehensive overview of my TikTok channel’s performance, offering actionable insights.
ACT
Based on the insights gained, I made data-driven changes to my content strategy:
1. Focused on creating high-performing content types (e.g., informative and educational).
2. Posted at the optimal times identified during the analysis.
3. Utilized hashtags and TikTok sounds strategically to maximize engagement.
Conclusion
This project not only helped me significantly grow my TikTok channel but also showcased the power of data-driven decision-making. By applying my data analysis skills, I achieved tangible results, and I’m excited to share this journey. I hope this project offers valuable insights and sparks conversations about the potential of data in creative spaces.
Phone
(234) 91-3225-8947Address
Oyo state,Nigeria