
Transforming
Introduction
This project focuses on analyzing sales performance from the Superstore dataset across various regions, customer segments, and product categories. The data includes transactions with details such as sales, profit, customer demographics, and shipping information. Through this analysis, actionable insights are generated to drive business decisions.
Project Objectives
1. To identify sales trends and key drivers of revenue growth.
2. To analyze performance across different regions, customer segments, and product categories.
3. To evaluate factors affecting delivery times, such as shipping modes.
4. To extract insights that can support better inventory management, marketing strategies, and operational efficiency.
Technologies Used
SQL: For querying and analyzing the data.
Microsoft SQL Server: As the platform for data management.
Steps
1. Data Loading and Exploration:
The dataset was loaded, and the structure of the data (rows and columns) was analyzed. The first step was to explore the dataset for any inconsistencies or potential cleaning requirements.
2. Data Cleaning:
Missing values were handled, particularly in columns such as postal codes and profit. Data types were corrected, especially for key fields like postal codes and order dates.
Business Questions
1. Total Sales by Region: The first analysis focused on identifying the total sales and profit across different regions. This helped in determining which regions were performing well and which ones needed more focus.
2. Sales Trends Over Time: Sales data was analyzed to identify trends over the years, particularly focusing on which months contributed the highest revenue. This provided insight into seasonal sales patterns and helped in planning for peak periods.
3. Segment-wise Sales Analysis: Customer segments were evaluated to identify which segments were generating the most revenue. Understanding the performance of different segments allows for better-targeted marketing efforts.
4. Shipping Mode Performance: The impact of different shipping modes on delivery times was analyzed. This revealed which shipping options were more efficient and whether any adjustments were needed to improve customer satisfaction.
Advanced Analysis
Common Table Expressions (CTEs), subqueries, and window functions were employed for deeper insights into customer behavior, sales performance, and delivery analysis. These techniques were used to assess average sales per customer, compare customer segments, and evaluate sales trends over time.
Dashboard
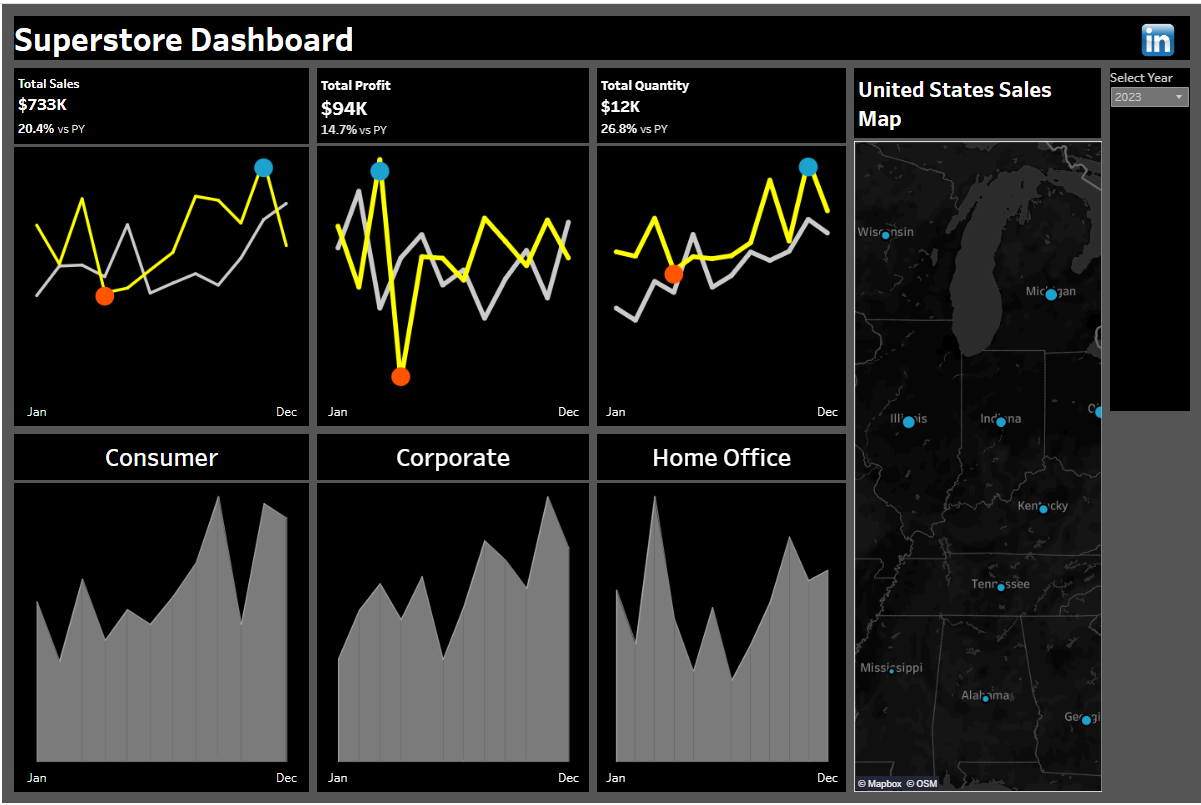
This dashboard effectively captures the overall business performance by focusing on key areas:
1. Sales Growth
2. Customer Segments
3. Geographic Performance
Conclusion
The Superstore analysis shows a stable 20.4% sales growth with a stronger 14.7% increase in profit, reflecting better cost management. Consumer and Corporate segments exhibit consistent performance, with noticeable seasonal spikes. Regions like California and New York are key markets for expansion. Additionally, the 26.8% increase in units sold indicates rising demand, providing opportunities for inventory optimization and improved customer outreach.